Hairline stat strip
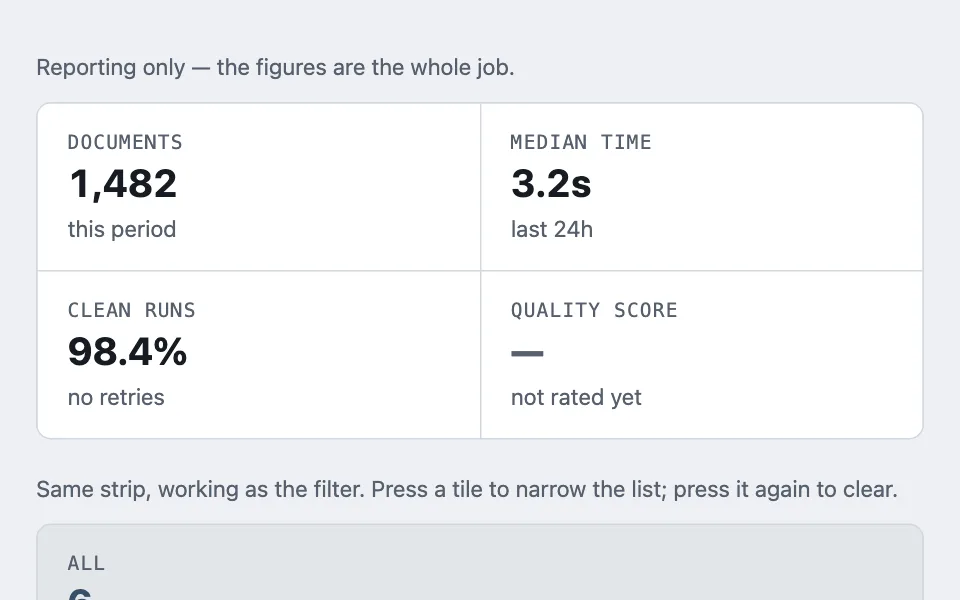
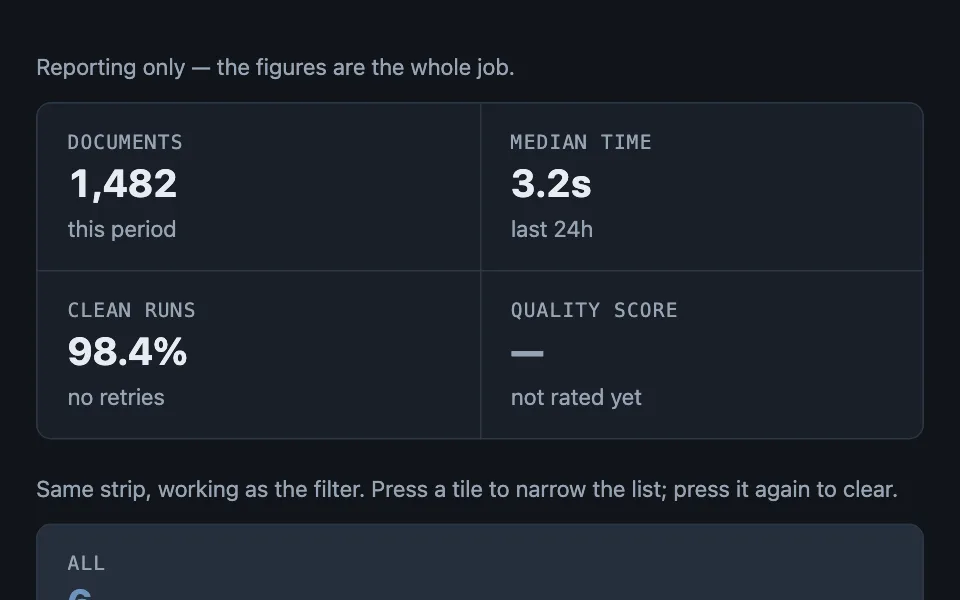
A row of stat tiles joined by hairlines that are grid gap, not borders — the container paints the border color and the tiles paint the surface, so separators never double up or break when the row wraps — in a reporting form and in a second form where each tile is the filter for the list beneath it.
Reach for it when building
- summary strip at the top of a detail page
- dashboard KPI row
- account usage overview
- report header figures
- profile stats band
<div class="hss-demo">
<p class="hss-caption">Reporting only — the figures are the whole job.</p>
<div class="hss-strip">
<div class="hss-tile" title="Documents processed in the current billing period">
<p class="hss-label">Documents</p>
<p class="hss-figure">1,482</p>
<p class="hss-hint">this period</p>
</div>
<div class="hss-tile" title="Median end-to-end processing time over the last 24 hours">
<p class="hss-label">Median time</p>
<p class="hss-figure">3.2s</p>
<p class="hss-hint">last 24h</p>
</div>
<div class="hss-tile" title="Share of runs that finished without a retry">
<p class="hss-label">Clean runs</p>
<p class="hss-figure">98.4%</p>
<p class="hss-hint">no retries</p>
</div>
<div class="hss-tile" title="No rating has been collected yet">
<p class="hss-label">Quality score</p>
<p class="hss-figure hss-empty">—</p>
<p class="hss-hint">not rated yet</p>
</div>
</div>
<p class="hss-caption">Same strip, working as the filter. Press a tile to narrow the list; press it again to clear.</p>
<div class="hss-strip hss-strip-live" id="hss-filters" role="group" aria-label="Filter downloads by status"></div>
<ul class="hss-list" id="hss-list"></ul>
<p class="hss-status" id="hss-status" role="status"></p>
</div>Colors come from shared theme tokens — --surface, --ink, --border, --accent and friends — so this CSS carries no palette
of its own. Use Runnable file to copy the tokens along with it.
.hss-strip {
	display: grid;
	grid-template-columns: 1fr;
	/* The whole trick: the 1px gap over the container's border-colored
	   background IS the separator. Real borders double where tiles meet and
	   break at the wrap edge; a gap cannot do either. */
	gap: 1px;
	background: var(--border);
	border: 1px solid var(--border);
	border-radius: var(--radius);
	overflow: hidden;
	max-width: 720px;
}

/* Column counts are pinned per breakpoint instead of left to auto-fit, and
   each step divides the tile count evenly: four tiles go 4 -> 2 -> 1, never
   a partial row. auto-fit can't promise that on its own -- tiles here are
   placed by normal grid auto-flow, so a row it can't fill stays in the grid
   as empty cells, and an empty cell paints straight through to the
   container's own border-colored background, a solid block where no tile
   sits. */
@media (min-width: 21rem) {
	.hss-strip { grid-template-columns: repeat(2, minmax(0, 1fr)); }
}

@media (min-width: 42rem) {
	.hss-strip { grid-template-columns: repeat(4, minmax(0, 1fr)); }
}

.hss-tile {
	background: var(--surface);
	padding: 1rem 1.25rem;
	margin: 0;
}

.hss-label {
	margin: 0;
	font-family: var(--mono);
	font-size: 0.8125rem;
	letter-spacing: 0.06em;
	text-transform: uppercase;
	color: var(--dim);
}

.hss-figure {
	margin: 0;
	font-size: 1.6rem;
	font-weight: 700;
	line-height: 1.25;
	font-variant-numeric: tabular-nums;
	color: var(--ink);
}

.hss-empty { color: var(--dim); }

.hss-hint {
	margin: 2px 0 0;
	font-size: 0.9375rem;
	color: var(--dim);
}

.hss-demo { display: flex; flex-direction: column; gap: 0.75rem; max-width: 720px; }
.hss-caption { margin: 0.5rem 0 0; font-size: 0.9375rem; color: var(--dim); }

/* The filtering variation is the same strip; only the tile becomes a
   control. Five tiles have no divisor between one and five, so there is no
   clean multi-column step in between -- this one pins straight from five
   columns to one rather than risk a partial row at two, three, or four. */
.hss-strip-live { gap: 1px; grid-template-columns: 1fr; }

@media (min-width: 42rem) {
	.hss-strip-live { grid-template-columns: repeat(5, minmax(0, 1fr)); }
}

/* The script fills button tiles with spans, which would otherwise run together
   on one line; stacking them matches the reporting tiles. */
button.hss-tile {
	display: flex;
	flex-direction: column;
	font: inherit;
	text-align: left;
	width: 100%;
	cursor: pointer;
	border: none;
	min-height: 44px;
}

button.hss-tile:hover { background: var(--surface-2); }

/* Pressed, not selected: the list below is a consequence of the press, and the
   tile stays a toggle that can be pressed again to clear. */
button.hss-tile[aria-pressed='true'] { background: color-mix(in srgb, var(--accent) 14%, var(--surface)); }
button.hss-tile[aria-pressed='true'] .hss-figure { color: var(--accent); }

.hss-list { list-style: none; margin: 0; padding: 0; display: flex; flex-direction: column; gap: 0.375rem; }

.hss-list li {
	padding: 0.55rem 0.7rem;
	border: 1px solid var(--border);
	border-radius: calc(var(--radius) - 4px);
	background: var(--surface);
	font-size: 0.9375rem;
}

.hss-status { margin: 0; font-size: 0.9375rem; color: var(--dim); min-height: 1.6em; }
const DOWNLOADS = [
{ title: 'Bicycle drivetrain teardown', status: 'Done' },
{ title: 'Kiln firing, part three', status: 'Downloading' },
{ title: 'Field recording — marsh at dawn', status: 'Queued' },
{ title: 'Lathe restoration, episode 12', status: 'Done' },
{ title: 'Sourdough hydration tests', status: 'Failed' },
{ title: 'Bookbinding: the long stitch', status: 'Queued' }
];
const STATUSES = ['All', 'Queued', 'Downloading', 'Done', 'Failed'];
const filters = document.getElementById('hss-filters');
const list = document.getElementById('hss-list');
const status = document.getElementById('hss-status');
let active = 'All';
function render() {
filters.innerHTML = '';
for (const name of STATUSES) {
// Counts come from the unfiltered set, so a tile never reports the number
// of things the current filter is already hiding.
const count = name === 'All' ? DOWNLOADS.length : DOWNLOADS.filter((item) => item.status === name).length;
const tile = document.createElement('button');
tile.type = 'button';
tile.className = 'hss-tile';
tile.dataset.name = name;
tile.setAttribute('aria-pressed', active === name ? 'true' : 'false');
tile.innerHTML = '<span class="hss-label"></span><span class="hss-figure"></span><span class="hss-hint"></span>';
tile.querySelector('.hss-label').textContent = name;
tile.querySelector('.hss-figure').textContent = String(count);
tile.querySelector('.hss-hint').textContent = count === 1 ? 'download' : 'downloads';
tile.addEventListener('click', () => {
active = name === 'All' || active === name ? 'All' : name;
render();
// render() just tore down and rebuilt every tile, including the one
// that was focused -- put focus back on the equivalent new one.
const refocused = filters.querySelector('[data-name="' + name + '"]');
if (refocused) refocused.focus();
});
filters.append(tile);
}
const shown = active === 'All' ? DOWNLOADS : DOWNLOADS.filter((item) => item.status === active);
list.innerHTML = '';
for (const item of shown) {
const row = document.createElement('li');
row.textContent = item.title + ' — ' + item.status;
list.append(row);
}
status.textContent =
active === 'All'
? 'Showing all ' + DOWNLOADS.length + ' downloads.'
: 'Filtered to ' + active + ': ' + shown.length + ' of ' + DOWNLOADS.length + '. Press the lit tile again to clear.';
}
render();Paste this into an agent to rebuild the pattern from scratch.
Build a strip of statistic tiles that reads as one joined instrument panel rather than a row of floating cards.
The separators between tiles must not be borders. Make the container a CSS grid with `gap: 1px` and give the container itself the border color as its background; each tile then paints the surface color on top. The 1px of container showing through the gap is the hairline. This is the entire pattern: real borders double where two tiles meet and leave a stray edge when auto-fit wraps the row, and a gap physically cannot do either. Wrap the container in a normal 1px border with a radius and `overflow: hidden` so the outer edge matches the hairlines.
**Pin the column count per breakpoint instead of reaching for `auto-fit`.** `repeat(auto-fit, minmax(160px, 1fr))` looks like it reflows for free, but it wraps by available width, not by tile count, and tiles here are placed by normal grid auto-flow rather than into their own tracks — so a row it can't fill stays in the grid as empty cells, and an empty cell paints straight through to the container's own border-colored background, a solid block sitting where no tile lives. Choose counts that divide the tile count evenly at every step, so the last row is always full: four tiles step 4 → 2 → 1. A count with no divisor between one and itself, like five, has no clean step in between — pin it straight from five columns to one, or pad the row out to a count that does divide.
Inside each tile: an uppercase label in the mono face at a small size with letter-spacing, the figure large and bold with `font-variant-numeric: tabular-nums` so digits align across tiles, and an optional dimmed hint line under it. Give every tile a `title` attribute stating in plain language what the metric measures, so derived figures explain themselves on hover.
Two rules of honesty. A tile whose value is missing still renders — with a dimmed em dash as its figure and a hint naming the action that would fill it ("not rated yet") — because an omitted tile reads as a missing feature and reflows its neighbours. And never put units in a separate visual channel from the number; keep "3.2s" as one string.
**The second form: make the tiles the filter.** The same strip, with each tile a button carrying `aria-pressed`, narrowing the list beneath it. This is worth reaching for when the figures people read are also the cuts they want — a queue by status, an inbox by state, a run by outcome. It saves a filter row that would otherwise sit directly under a set of numbers naming the same categories.
**Compute the counts from the unfiltered set.** A tile that reports how many rows survive the current filter is a number that changes when you press a different tile, which makes the strip unreadable as a summary. The counts are the census; the filter is a view of it.
Press the lit tile again to clear, and give "All" the same behaviour, so there is always a way back that does not require guessing which control resets. Filtering to zero is the one case that needs its own words beneath — the list is empty for a reason someone can act on.
Use `aria-pressed` rather than tab semantics. The list below is a consequence of the press, not a panel belonging to a tab, and tab roles promise arrow-key movement between panels that this does not have.
Every color comes from theme custom properties, and the strip has to read correctly in both light and dark themes.