Benchmark progress bar
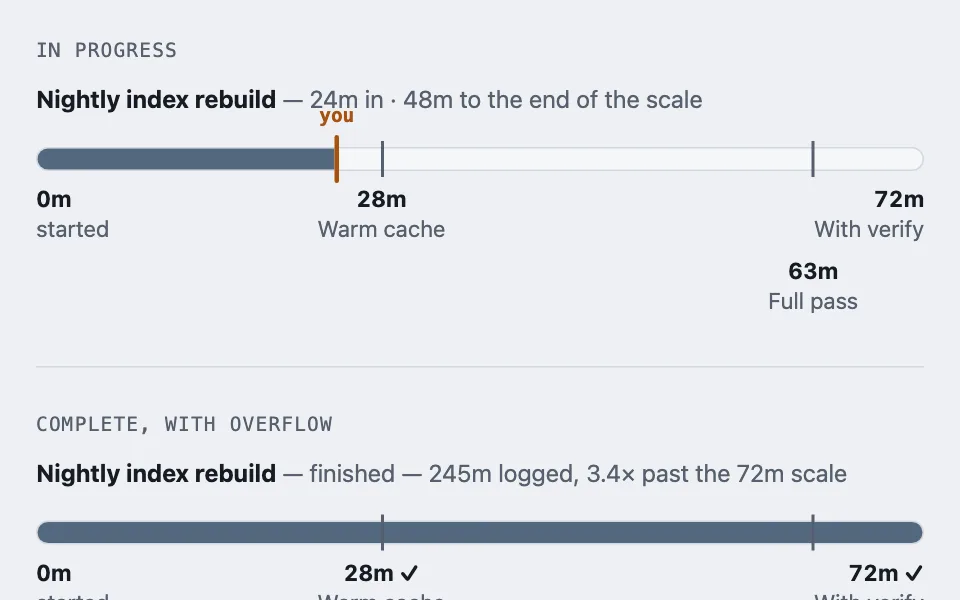
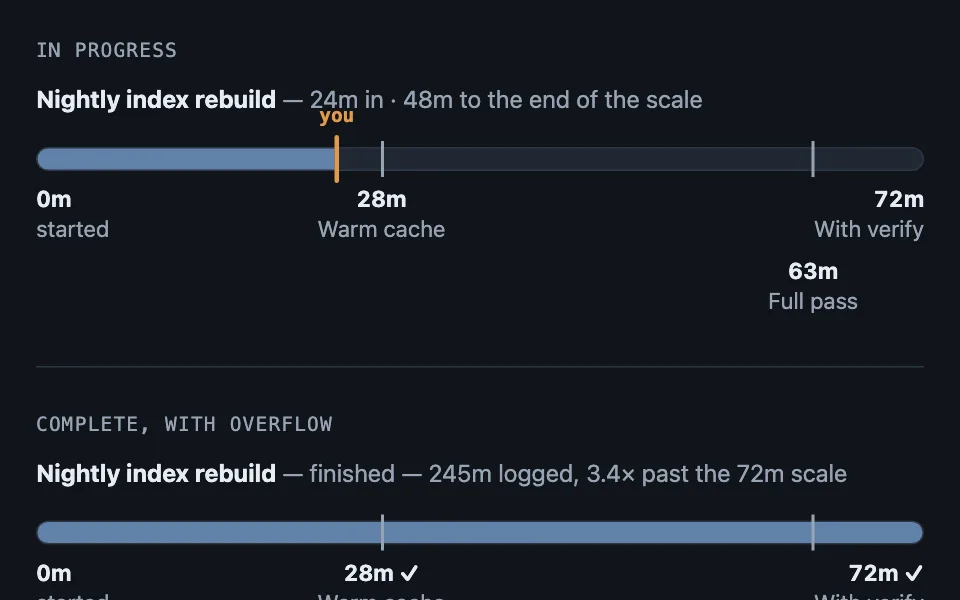
Places a raw figure on a scale of external benchmarks instead of printing it plain, so a number becomes "most of the way to the long estimate" — with the inverted form, where the track itself is banded into zones, for the cases where the limit is the scale.
Reach for it when building
- course progress against module estimates
- project spend against past projects
- latency against published service tiers
- playtime against completion milestones
- onboarding checklist progress
- credit or margin used against a limit
- storage or quota with a safe and a risky band
<div class="bench-stack">
<div class="bench-instance">
<p class="bench-state">In progress</p>
<p class="bench-heading"><strong>Nightly index rebuild</strong> <span class="bench-muted">— 24m in · 48m to the end of the scale</span></p>
<div class="bench-track">
<div class="bench-fill" style="width: 33.56%; border-radius: 8px 0 0 8px;"></div>
<div class="bench-tick" style="left: 38.89%;"></div>
<div class="bench-tick" style="left: 87.5%;"></div>
<div class="bench-you" style="left: 33.56%;"></div>
</div>
<div class="bench-labels">
<div class="bench-label-item bench-edge-start"><b>0m</b>started</div>
<div class="bench-label-item" style="left: 38.89%;"><b>28m</b>Warm cache</div>
<div class="bench-label-item" style="left: 87.5%; top: 3rem;"><b>63m</b>Full pass</div>
<div class="bench-label-item bench-edge-end"><b>72m</b>With verify</div>
</div>
</div>
<div class="bench-instance">
<p class="bench-state">Complete, with overflow</p>
<p class="bench-heading"><strong>Nightly index rebuild</strong> <span class="bench-muted">— finished — 245m logged, 3.4× past the 72m scale</span></p>
<div class="bench-track">
<div class="bench-fill" style="width: 100%; border-radius: 8px;"></div>
<div class="bench-tick" style="left: 38.89%;"></div>
<div class="bench-tick" style="left: 87.5%;"></div>
</div>
<div class="bench-labels">
<div class="bench-label-item bench-edge-start"><b>0m</b>started</div>
<div class="bench-label-item" style="left: 38.89%;"><b>28m ✓</b>Warm cache</div>
<div class="bench-label-item" style="left: 87.5%; top: 3rem;"><b>63m ✓</b>Full pass</div>
<div class="bench-label-item bench-edge-end"><b>72m ✓</b>With verify</div>
</div>
</div>
<div class="bench-instance">
<p class="bench-state">Zoned — the scale itself is subdivided</p>
<p class="bench-heading"><strong>Margin used</strong> <span class="bench-muted">— 38% of the line drawn, 12 points of comfortable headroom left</span></p>
<div class="bench-track">
<div class="bench-zones">
<div class="bench-zone bench-zone-ok" style="width: 50%;"></div>
<div class="bench-zone bench-zone-warn" style="width: 30%;"></div>
<div class="bench-zone bench-zone-bad" style="width: 20%;"></div>
</div>
<div class="bench-fill" style="width: 38%; border-radius: 8px 0 0 8px;"></div>
<div class="bench-tick" style="left: 50%;"></div>
<div class="bench-tick" style="left: 80%;"></div>
<div class="bench-you" style="left: 38%;"></div>
</div>
<div class="bench-labels">
<div class="bench-label-item bench-edge-start"><b>0%</b>nothing drawn</div>
<div class="bench-label-item" style="left: 50%;"><b>50%</b>Comfortable to here</div>
<div class="bench-label-item" style="left: 80%; top: 3rem;"><b>80%</b>Call risk</div>
<div class="bench-label-item bench-edge-end"><b>100%</b>The whole line</div>
</div>
</div>
<div class="bench-instance">
<p class="bench-state">No benchmark data</p>
<div class="bench-callout">
<h4>No benchmark match</h4>
<p>Nothing to place this against yet. Link a benchmark source to get a scale.</p>
</div>
</div>
</div>Colors come from shared theme tokens — --surface, --ink, --border, --accent and friends — so this CSS carries no palette
of its own. Use Runnable file to copy the tokens along with it.
.bench-stack { display: flex; flex-direction: column; gap: 1.75rem; max-width: 620px; }

.bench-instance { padding-bottom: 1.75rem; border-bottom: 1px solid var(--border); }
.bench-instance:last-child { padding-bottom: 0; border-bottom: none; }

.bench-state {
	margin: 0 0 0.6rem;
	font-family: var(--mono);
	font-size: 0.8125rem;
	letter-spacing: 0.06em;
	text-transform: uppercase;
	color: var(--dim);
}

.bench-heading { margin: 0 0 1.1rem; }
.bench-muted { color: var(--dim); }

.bench-track {
	position: relative;
	height: 16px;
	border-radius: 8px;
	background: var(--surface-2);
	border: 1px solid var(--border);
}

.bench-fill {
	position: absolute;
	inset: 0 auto 0 0;
	background: var(--accent);
	opacity: 0.85;
}

/* The inverted form: instead of marks placed on the track, the track itself is
   banded. The zones tile as a flex row so there are no seams between them, and
   the fill is drawn over the top against the same denominator. */
.bench-zones { position: absolute; inset: 0; display: flex; border-radius: 8px; overflow: hidden; }
.bench-zone { height: 100%; }
.bench-zone-ok { background: color-mix(in srgb, var(--ok) 22%, var(--surface-2)); }
.bench-zone-warn { background: color-mix(in srgb, var(--warn) 26%, var(--surface-2)); }
.bench-zone-bad { background: color-mix(in srgb, var(--bad) 24%, var(--surface-2)); }

/* Over a banded track the fill has to stay readable against three different
   grounds, so it is the ink rather than the accent. */
.bench-track:has(.bench-zones) .bench-fill { background: var(--ink); opacity: 0.72; }

/* One tick per milestone that the scale hasn't already reached — the scale's
   own last milestone sits at 100% and gets no tick, since the fill's own
   right edge already marks it. */
.bench-tick {
	position: absolute;
	top: -5px;
	bottom: -5px;
	width: 2px;
	background: var(--dim);
}

.bench-you {
	position: absolute;
	top: -9px;
	bottom: -9px;
	width: 3px;
	border-radius: 2px;
	background: var(--signal);
}

.bench-you::after {
	content: 'you';
	position: absolute;
	top: -1.4rem;
	left: 50%;
	transform: translateX(-50%);
	font-size: 0.8125rem;
	font-weight: 700;
	color: var(--signal);
	font-family: var(--mono);
}

.bench-labels {
	position: relative;
	/* Tall enough for two label rows: a dropped label starts below a
	   two-line label rather than colliding with its second line. */
	height: 5.8rem;
	margin-top: 0.6rem;
}

.bench-label-item {
	position: absolute;
	transform: translateX(-50%);
	text-align: center;
	white-space: nowrap;
	line-height: 1.3;
	font-size: 0.9375rem;
	color: var(--dim);
}

.bench-label-item b {
	display: block;
	color: var(--ink);
	font-variant-numeric: tabular-nums;
}

.bench-edge-start { left: 0; transform: none; text-align: left; }
.bench-edge-end { right: 0; transform: none; text-align: right; }

.bench-callout {
	border: 1px solid var(--border);
	border-left: 4px solid var(--dim);
	border-radius: var(--radius);
	background: var(--surface);
	padding: 0.9rem 1.1rem;
}

.bench-callout h4 { margin: 0 0 0.35rem; color: var(--dim); }
.bench-callout p { margin: 0; }
Paste this into an agent to rebuild the pattern from scratch.
Build a progress bar that places a duration or a count on a scale of known benchmarks, instead of printing the raw figure on its own — turn "42 hours" into "most of the way to the long ending."
Reach for it wherever a number only means something in comparison to reference points a person already has in their head: time on a course against its stated module estimates, project spend against comparable past projects, a latency figure against published service tiers. Skip it for a value with no natural benchmarks (revenue this month has no fixed ceiling to draw a bar against) and skip it where the raw number is already the point, like a live counter — the framing effort isn't worth it there.
Do all the arithmetic in one pure function that takes the current figure and the milestone list and returns a discriminated union with three variants, so the component itself holds no state and can render on the server:
- `no-match` when there's no benchmark data yet. - `in-progress` when the figure is below the largest milestone: carries a `fraction` (figure divided by the scale) plus each milestone's own fraction and whether it's been reached. - `done` when the figure is at or past the largest milestone: carries an `overflow` ratio (figure divided by scale) instead of a fraction.
The scale is always the **longest** available milestone, never a shorter one and never a fixed round number — anchoring the track to the biggest reference point is what guarantees the "you are here" marker can never sit past a tick that still reads as "ahead of you."
Overflow is its own state, not a bar drawn past 100%. Once the figure passes several multiples of the scale, drawing it to true scale would compress every ordinary bar down to a sliver, so past that point render the bar full, keep the milestone ticks in their fixed positions, and move the multiplier into the heading text instead ("3.4× past the 72m scale") rather than trying to extend the bar itself.
Milestone labels sit under the track, each horizontally centered on its own tick except the first (pinned left, reading "started") and the last (pinned right, flush with the bar's own end). Any label whose tick lands at 78% or further along — and that isn't the final one — has to drop to a second line beneath the row, or it collides with the right-anchored final label; only the check for "not last" keeps the final label itself from being pushed down too.
The missing-data branch is a bordered callout with a message and a pointer at whatever repairs the gap (link a source, connect an integration), never an empty or zero-width bar — a bar at 0% visually asserts the value is zero, when the truth is that it's unknown, which is a different and worse claim to make by accident.
**The inverted form: band the track instead of marking it.** Where the benchmarks are external reference points, they are ticks on a plain track. Where the scale *is* the limit — a credit line, a quota, a margin account — subdivide the track itself into zones and draw the usage over the top. That turns two things into visible area that ticks leave implicit: the headroom before the next band, and the part of the total that was never really available.
Every zone width and the fill are fractions of the same denominator, which is what lets the fill be absolutely positioned over the zone strip and read directly against it. Tile the zones as a flex row so there are no seams, and keep the tick labels for the band boundaries — the colour says "this band is worse", the label says at what number.
Change the fill colour when the track is banded. An accent fill that read clearly on one flat track now has to stay legible over three different grounds, so the ink token at partial opacity is the safer choice than the accent.
Every color comes from theme custom properties, and the whole set has to read correctly in both light and dark themes.